MDR or O&D?
Severance: S1, E6 “Hide and Seek”
Production and Costs: Marginal Analysis
Macrodata Refinement (MDR) is on a mission to unite the departments on Lumon’s severed floor. When they arrive on Optics and Design (O&D), they find a much larger department than they expected.
“This is more people than I’ve ever seen.”
MDR is a department of only four. It turns out, O&D has eight workers. Why is Optics and Design twice as large? And what does that tell us about the mysterious and important work the innies are up to on the severed floor?
To simplify the analysis, assume we can put dollar values on the tasks being completed on its severed floor. Call these values “benefits” and assume Lumon is trying to maximize them. If a department has no workers, the department generates no total benefits to Lumon. As severed workers are added to each department, total benefits increase.
An important consideration is how much total benefits increase with each additional worker added. These are marginal benefits, and they shrink (either immediately or at some point) as departments grow. This happens because as more workers are added, they begin to overlap in tasks, struggle to coordinate, and contribute less additional value than the workers before them.
The tables below quantify how different department sizes of MDR and O&D generate benefits to Lumon, where Q refers to the number of workers in the department.
Macrodata Refinement
Optics and Design
|
Q
|
Total Benefits
|
Marginal Benefit
|
|---|---|---|
|
0
|
$0
|
-
|
|
1
|
$130,000
|
$130,000
|
|
2
|
$250,000
|
$120,000
|
|
3
|
$350,000
|
$100,000
|
|
4
|
$420,000
|
$70,000
|
|
5
|
$470,000
|
$50,000
|
|
6
|
$510,000
|
$40,000
|
|
7
|
$545,000
|
$35,000
|
|
8
|
$577,500
|
$32,500
|
|
9
|
$608,750
|
$31,250
|
|
Q
|
Total Benefits
|
Marginal Benefit
|
|---|---|---|
|
0
|
$0
|
-
|
|
1
|
$98,000
|
$98,000
|
|
2
|
$198,000
|
$100,000
|
|
3
|
$298,000
|
$100,000
|
|
4
|
$396,000
|
$98,000
|
|
5
|
$490,000
|
$94,000
|
|
6
|
$578,000
|
$88,000
|
|
7
|
$658,000
|
$80,000
|
|
8
|
$728,000
|
$70,000
|
|
9
|
$786,000
|
$58,000
|
A one-worker MDR generates $130,000 in total benefits. Adding a second refiner to the department boosts total benefits to $250,000. The difference in total benefits is the marginal benefit: $120,000.
As Mr. Milchick and Ms. Cobel consider the optimal sizes of these departments, marginal benefit will be their primary focus. The graph below provides a visual for how marginal benefit changes as each department varies in size.
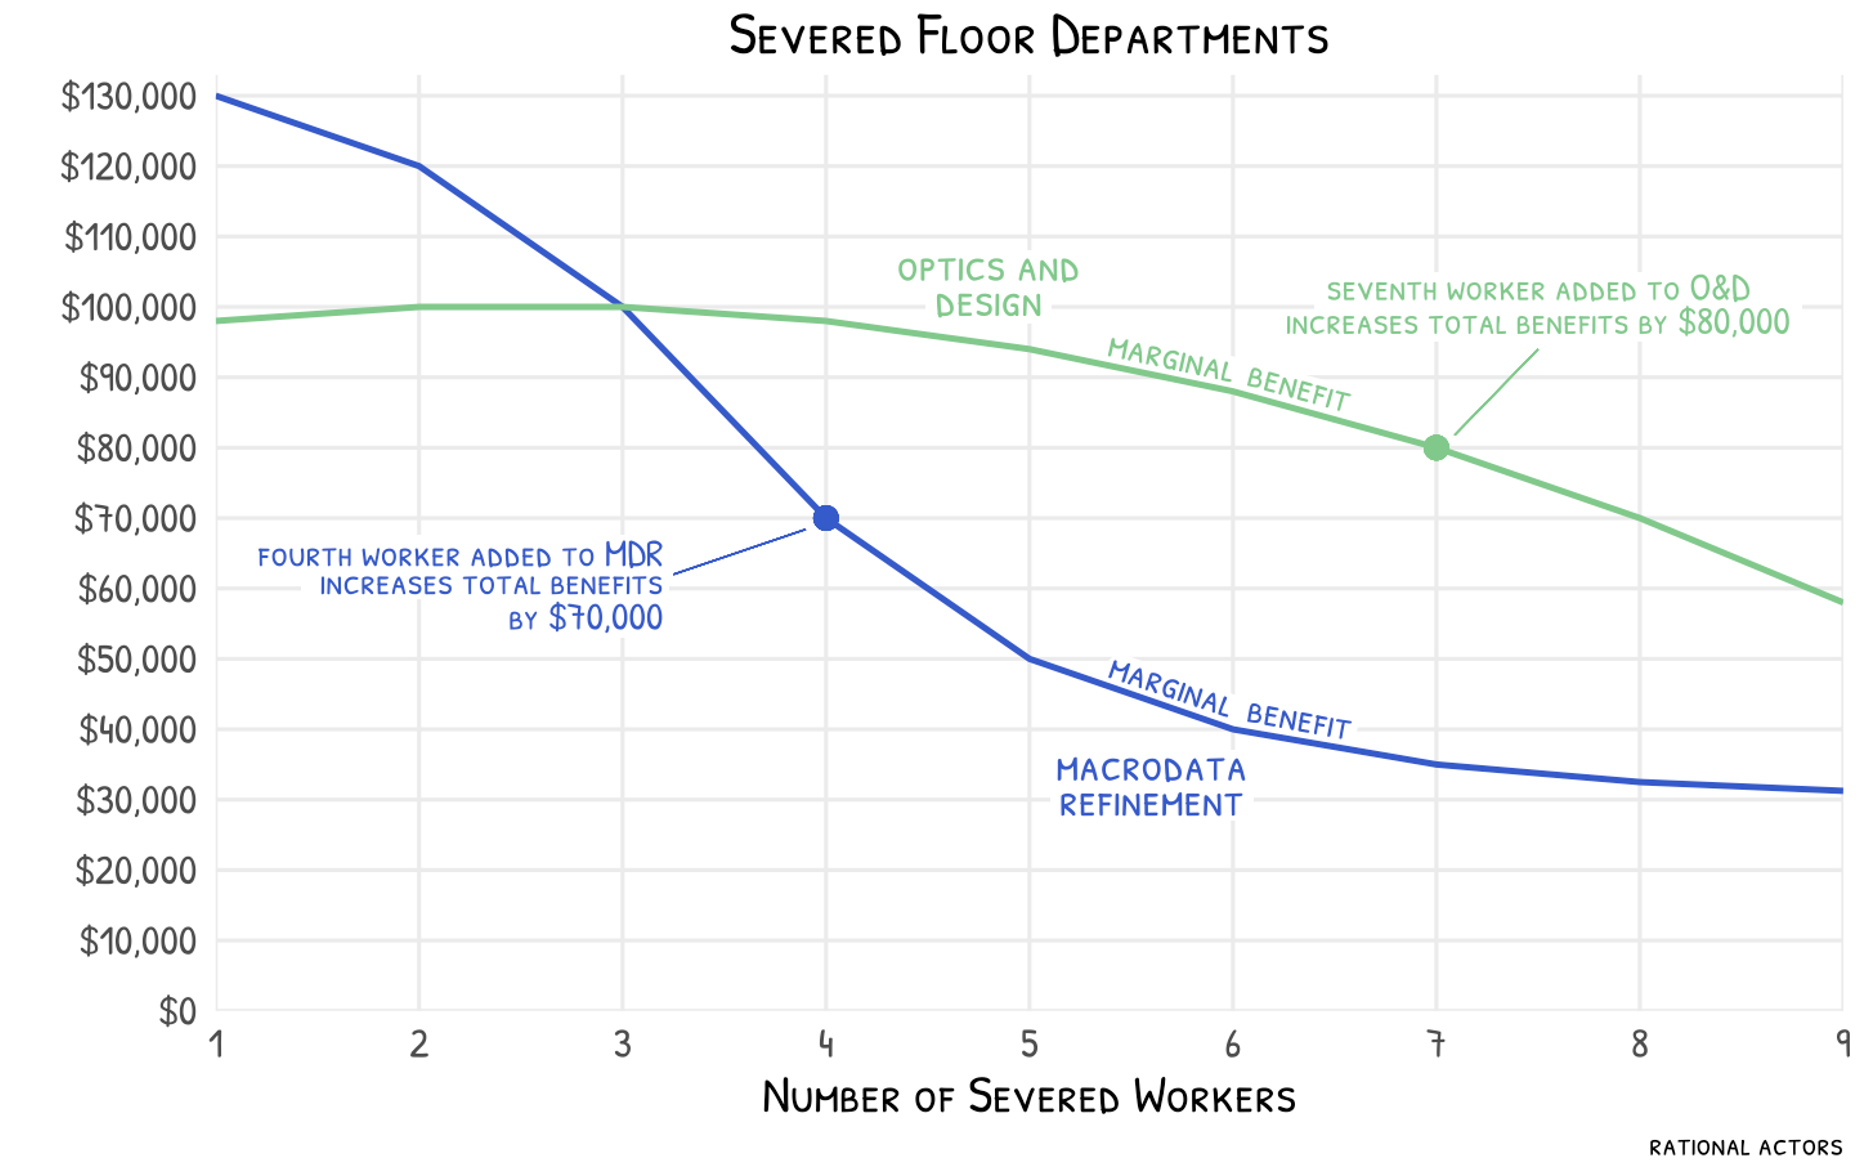
The shapes of these curves tell us that the boost to total benefits from adding workers starts off very high in MDR and falls quickly. For O&D, it’s a more gradual fall. Perhaps coordination issues don’t set in so quickly.
The next step in building this model is to consider costs. Management will continue adding workers to these departments if the boost to benefits exceeds the additional costs. Those additional costs, the ones that kick in when an additional worker is added, are marginal costs. Because of the nature of the severance procedure, where workers enter the severed floor as relative blank slates, it’s likely that severed workers earn the same salaries regardless of department.1 And since workers are paid the same across departments, marginal costs are identical no matter where workers are placed.
This leads to several interesting conclusions about the way Lumon splits up its severed workers. First, we can see how Lumon settles on the department sizes by adding marginal costs to our model.

Lumon wants to maximize net benefits (total benefits minus total costs), which occurs where marginal benefit equals marginal cost. That means a four-person MDR and an eight-person O&D. It’s unlikely that Lumon (or any business for that matter) can so simply model the benefits of each of its departments in this way.2 But by analyzing the outcome, we can generate some simple rules of thumb for decision-makers looking to make the most of similar situations.
Rule 1: the marginal benefit of the last worker in each department should be equal
Suppose it was not the case. Suppose each department had 6 workers. The marginal benefit of the last worker in MDR is $40,000 but $88,000 in O&D. The gap in these two numbers suggests that moving a refiner from MDR costs Lumon $40,000 in lost benefits. But moving that same refiner to O&D adds $88,000 in total benefits, leading to a large gain overall. If there is a gap in the marginal benefits across departments, there are gains to be had by shuffling workers from the department with a lower marginal benefit to the department with a higher marginal benefit.3
This tells us that decision-makers need not have a fully fleshed out model of how their departments generate benefits at all possible sizes. They only must estimate how helpful or harmful it is to add a worker to a department or subtract one from it. The margin is where the action is.
Rule 2: average benefits are a misleading guide to decision-making
Following Rule 1, the severed floor ends up with a split that leads MDR to produce $420,000 in total benefits with four workers. On average, each refiner produces $105,000 in value.4 Meanwhile in O&D, the average benefits are $91,000. It may be easy for management to see that MDR produces a lot of value for such a small department relative to the value produced by O&D. Why not shift some designers over to MDR?
Following rule 1, the severed floor creates a combined $1.206 million in benefits. But if you add a worker to MDR and subtract from O&D, the total falls to $1.128 million. Averages mislead, because the biggest boosts to total benefits in MDR come from the first few workers. Optimal planning requires marginal thinking.
And these rules extend to situations where there are more than two departments.
“We found a department the opposite way from here that’s, well, raising baby goats.”
What will they find in the goat department? How many workers will be there? That’s unclear. But if Lumon management is on the ball, the marginal benefit of the last worker in the goat department will be equal to the marginal benefits of the last worker in MDR and O&D.
“Everything we do here is important.”
“It’s important because it actually is or because you’re saying it is?”
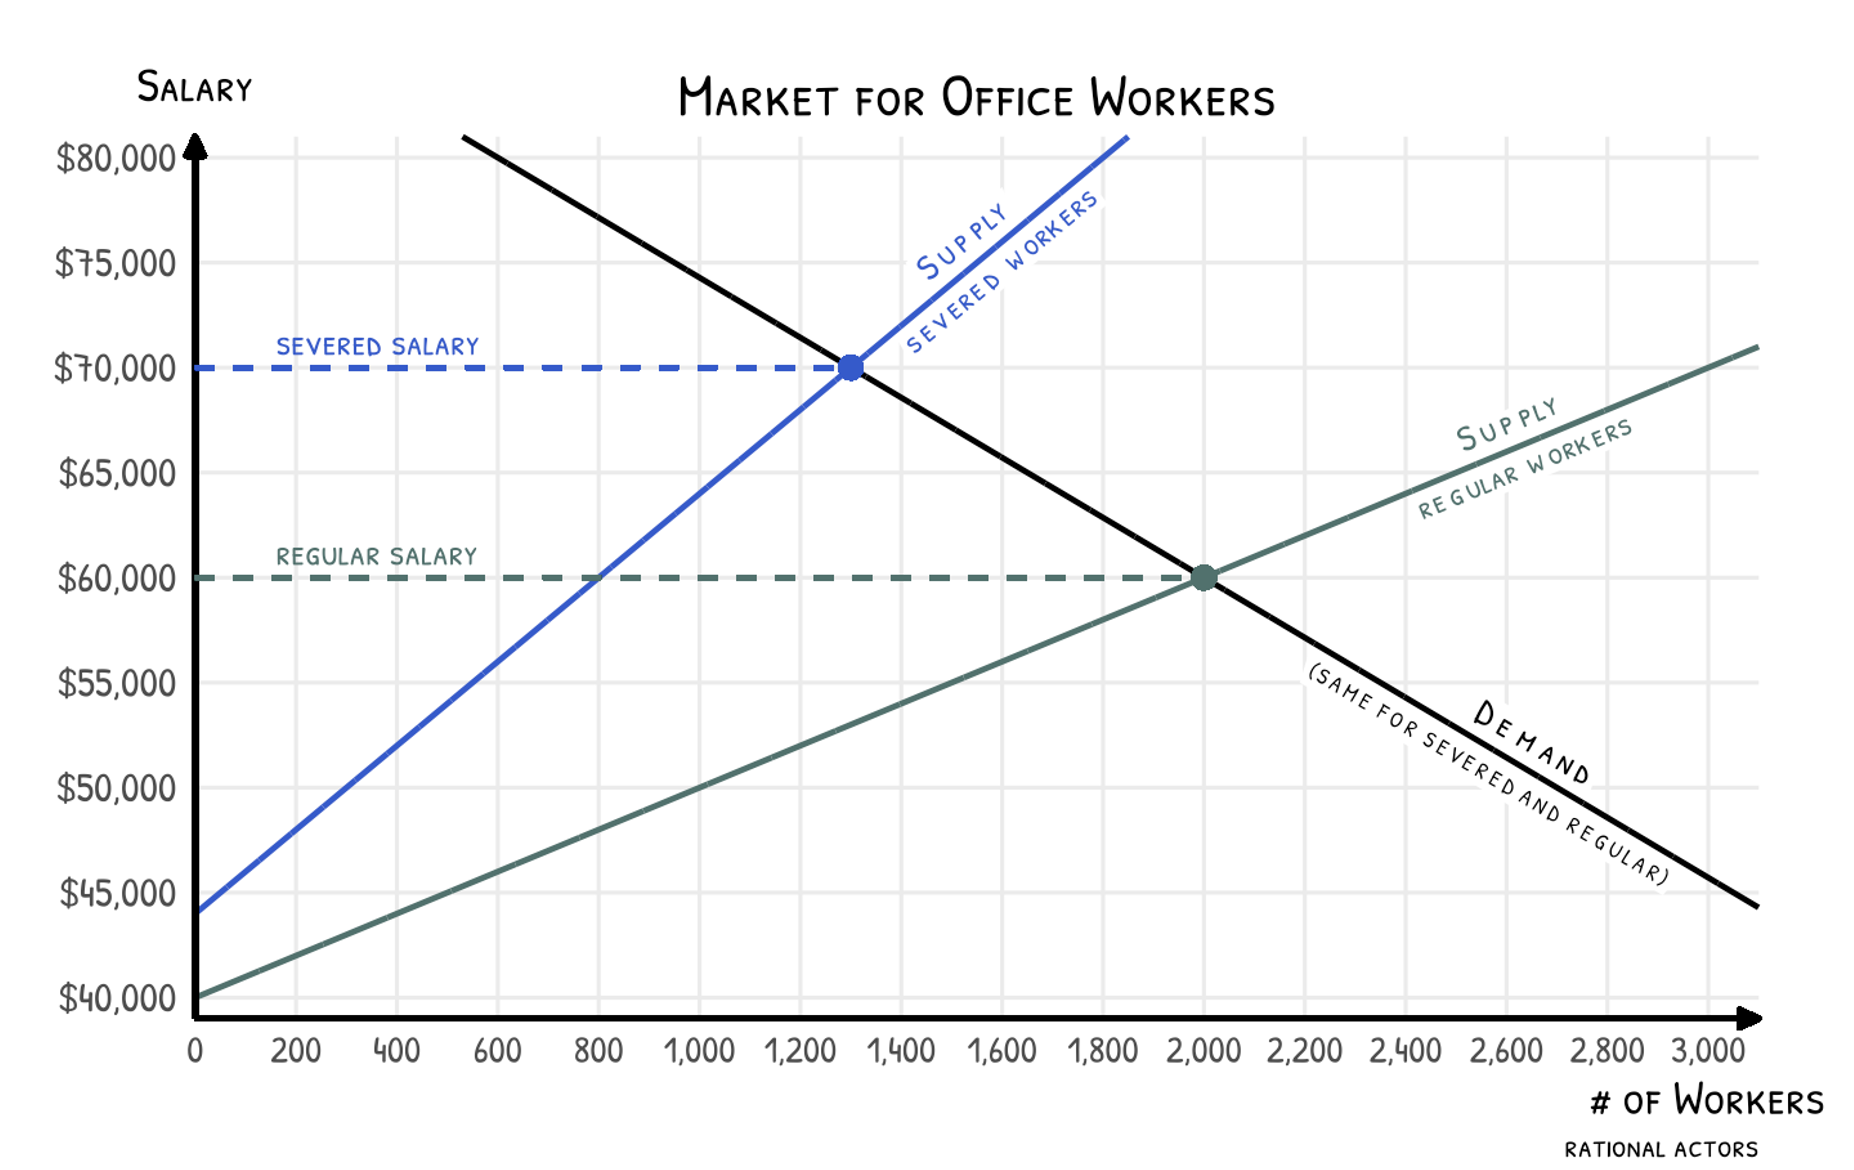
1 Also keep in mind that outies know nothing about what happens on the severed floor. Therefore, Lumon would be unable to advertise jobs on the severed floor that are different in any way, including on salary.
2 For example, what are the benefits to a company as it varies the size of its human resource department? And how can it quantify these benefits in a way that enables comparisons to the benefits generated by a sales department? Not easy.
3 This depends crucially on the assumption of equal pay across departments. Suppose instead that refiners made hundreds of thousands of dollars and designers made pennies. In that case, Lumon could easily justify adding workers to O&D who seem to contribute little to total benefits, because their marginal cost is so small. If pay differs across departments, then the ratio of marginal benefit to marginal cost should be equal across departments, rather than simply equating marginal costs.
4 Average benefits = total benefits / number of workers.

More from Severance:


1 Also keep in mind that outies know nothing about what happens on the severed floor. Therefore, Lumon would be unable to advertise jobs on the severed floor that are different in any way, including on salary.
2 For example, what are the benefits to a company as it varies the size of its human resource department? And how can it quantify these benefits in a way that enables comparisons to the benefits generated by a sales department? Not easy.
3 This depends crucially on the assumption of equal pay across departments. Suppose instead that refiners made hundreds of thousands of dollars and designers made pennies. In that case, Lumon could easily justify adding workers to O&D who seem to contribute little to total benefits, because their marginal cost is so small. If pay differs across departments, then the ratio of marginal benefit to marginal cost should be equal across departments, rather than simply equating marginal costs.
4 Average benefits = total benefits / number of workers.